

Introduction
Sports Scientists and coaches have suggested that the ability to perform short bursts of sprints with minimal recovery periods in between them (Repeat sprint ability, RSA), may be influential in determining the result of many different sporting events, including team and individual sports (Jougla et al 2010; Oliver et al 2007; Spencer et al 2005). The ability to recover and maintain maximal effort during subsequent sprints is an important determinant to a successful performance, which shows us the importance of the understanding of the physiological effects that such sprints will have on an athlete. This present study specifically focuses on the rest period duration (15 Seconds(s) and 120 Seconds(s)) and how this will effect sprint performance, as it has been identified as an influential factor on sprint performance (Billaut and Basset 2007; Spencer et al 2005).
For single short maximal sprints (<6 seconds), energy provision is maintained predominantly from anaerobic sources phosphorcreatine (PCr) degradation and Glycolysis, with a minimal contribution from aerobic metabolism. Recovery is symbolised as the body’s ability to return to homeostasis (Glaister 2005). Without sufficient bouts of recovery, the onset of fatigue will occur due to the depletion Adenosine Tri Phosphate (ATP), Phosphorcreatine (PCr) and the accumulation of hindering sources such as inorganic Phosphate molecules (iP). The body stores only 80g to 100g of ATP (Dick 2002) which isn’t enough for sustained sprinting (Noakes 2000), showing the need for resynthesis. The intramuscular PCr stores in a resting state are usually around 75-85 mmol/KG dm (Spencer et al 2005) with a maximal PCr turnover rate of around 7-9 mmol/ KG dm/ sec, enough time for around 5s of maximal effort sprinting. Fatigue can be viewed as the inability to continue exercise at any given intensity (Robergs & Roberts 1997). There are two types of fatigue, 1) Central fatigue; factors such as the recruitment of muscle fibers by motor units and motivation are considered. 2) Peripheral fatigue; split into 4 types, depletion of PCr, Lack of Glycogen availability, decline in intracellular pH and accumulation of iP (McMahon & Jenkins 2002; Glaister 2005). It is notable that PCr acts as a buffer for ATP and a moderate correlation as been made between PCr depletion and fatigue. Casey (1996) studied 9 male participants over 2 bouts of 30 seconds maximal bike sprints. It was found that PCr decreased from 83.9 ± 3.6 to 34.8 ± 4.5 mmol/kg, whilst ATP reduced by 23.9 ± 0.4 decreased to 18.7 ± 1.3 mmol/kg. A distinct reduction in both PCr and ATP is evident with a more clear reduction in the levels of PCr. The recovery duration is important in the restoration and resynthesis of PCr and ATP (Glaister 2005; Spencer et al 2005). Harris et al (1976) carried out 5 studies using all male participants between 18- 30 years old, on the lengths of recovery in relation to PCr levels. It was found that the longer rest duration, the more PCr that is re-synthesised. 21 seconds worth of recovery time would only be enough to re-synthesise 50% of the homeostasis state, with 84% after 2 minutes. For a 100% re-synthesis a 20 minute rest period would be necessary. When the recovery duration is short, the PCr levels cannot reach sufficient levels to produce a maintained high intensity sprint, lowering sprint ability (Glaister 2005). The lack of PCr (2nd Peripheral fatigue) means there will be an increased demand on the anaerobic Glycolysis system, its main limitation is that its end process produces pyruvate, which is transported to the mitochondria, oxidised to acetyl co-A and converted to lactate; with hydrogen being the limiting waste product. This factor directly correlates with the 3rd type of peripheral fatigue as the hydrogen ions play a huge role in declining the pH in the muscle cells causing the onset of muscular acidosis. The calcium ions from the sarcoplasmic reticulum are sensitive to change in the levels of acidity, causing an interference with the binding of the troponin heads in muscular contraction. Acidosis impairs the body’s capacity for Glycolysis, whilst the onset of hydrogen ions inhibits Phosphorylase and Phosphofructokinase (PFK), key regulatory enzymes; again decreasing the ability and speed of ATP resynthesis. Glaister (2005) Studied Twenty-five male physical education and sport science students. The mean ± SD values for age, height, body mass, and predicted percentage of body fat (7-site skinfold protocol) were 20.6 ± 1.5 years, 177.2 ± 5.4 cm, 78.2 ± 8.2 kg, and 11.9 ± 4.7%, respectively. 2 multiple sprint test protocols with contrasting recovery periods, each protocol was separated by a minimum 24-hour rest period. Protocol 1 consisted of 20x5s sprints separated by 10s recovery periods. Protocol 2 consisted of 20x5s sprints separated by 30-second recovery periods. It was again found that the Recovery duration had a significant effect on measures of maximum mean power output, with a suggestion that the 10s recovery periods provided insufficient restoration of homeostasis.
Aim
To determine whether there is an influence of recovery duration on Repeated Sprint Ability (RSA).
Null Hypothesis
There will be no significance between the 15 seconds and 120 seconds recovery periods on RSA.
Research Design
This study was a repeated measured design between two different groups (15s recovery and 120s recovery).
Participants
8 male participants, all sports students who volunteered to take part in the study. Mean age of 20 years ± 2.07, mean weight of 75 KG ± 7.73 and mean height of 179 cm ± 3.17. They were all accustomed to the procedures of the study.
Ethics
All participants completed a pre-test and blood screening questionnaire and also gave written consent to be involved within the study. It was made clear that resignation from the study at any time was possible. As bloods were being taken, professional conduct was maintained and needles were never reused and were disposed of in sharps bins immediately after testing. A relevant warm up and cool down procedure was undertaken.
Procedures
Eight participants were selected and completed a pre-test questionnaire, blood screening document and provided written consent to be involved within the study. All the participants were informed of the testing procedures and understood they could withdraw from the study at any particular time. Participants were assigned randomly into two groups, 15s recovery or 120s recovery. The participants then recorded height (cm), weight (kg), resting heart rate (b/min) (Polar HR monitor) and resting blood lactate (mM) (Lactate Pro) at homeostasis state. Participants completed a comprehensive warm up for 10 minutes, starting at a light jog progressing through to faster strides. A series of dynamic sprint related stretching was used to reduce risk of injury.
4 x 25m areas were set up with a timing gate at the start and at the finish of the area (Tag Heurer). On the completion of the warm up the participants completed 10 x 25 m sprints interspersed with their allocated recovery period (15 s or 120 s). The times of each sprint were collated using the timing gates. The rate of perceived exertion (RPE) (Borg 1982) was gathered at the end of each sprint. The Heart rate of the participants was gathered at the beginning of each sprint and at the end of each sprint using Heart rate monitors.
After the completion of the sprints the participants undertook a light cool down consisting of slow movements and static stretching. Post blood lactate was taken three minutes after the last sprint was performed. Participants completed a thorough warm-down, and were advised to replenish fuel stores via consumption of a light carbohydrate snack.
Data analysis
All of the collected data was inserted to Microsoft excel. All data are expressed as mean (±SD), and statistical significance set at P<0.05. All statistical tests were carried out using SPSS software. Repeated measures one-way ANOVA was used to evaluate the difference between the treatments for all dependent measures.
Results
Figure 1 shows that the 120s rest duration sprint times were faster and more consistent than the 15s times. The 15s sprint times got slower over the course of the 10 sprints. Statistical analysis shows a significant difference (p <0.05).
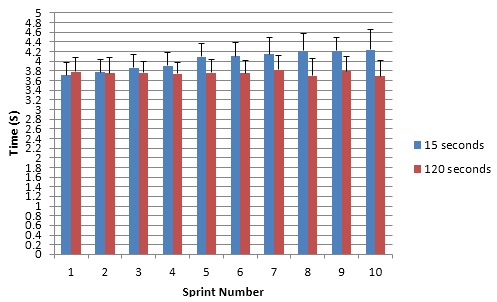
FIG 1 Times (s) for 10 x 25m sprints for 15s and 120s recovery periods. Results are mean data ± SD.
Fig 2 shows rest Blood Lactate for the 15s and 120s recovery (p >0.05) showing no significance. This is expected as both reading were taken at homeostasis. It also shows post blood lactate levels (p <0.05), with statistical analysis showing a significance.

FIG 2 Mean blood lactate levels ± SD for both 15s and 120s in pre and post lactate testing.
FIG 3 shows that there is a clear difference between the fatigue indexes of the two recovery periods. (p<0.05) statistically indicating a significant difference.
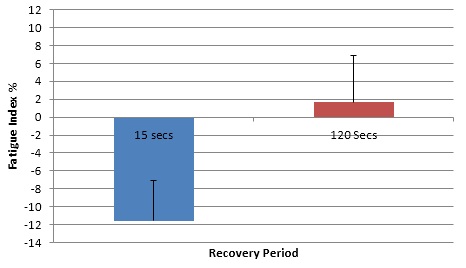
FIG 3 Mean fatigue index percentage ± SD, for 15s and 120s recover.
FIG 4 the heart rate before each of the 15s recovery sprints were higher than that of the 120s. It is noticeable that the HR before the 15s recovery sprints wasn’t significantly different to the readings taken afterwards (see FIG 4(a)). (p<0.05) showing statistical significance. FIG 4 Mean Heart rate before each of the 10x25m sprints ± SD for both 15s and 120s recovery.

FIG 4(a) alike the pre sprint heart rates shown in FIG 4, there is a clear difference between the two recovery periods HR’s. (p <0.05) showing relevant significance.

FIG 4(a) Mean Heart after each of the 10 x 25m sprints ± SD for both 15s and 120s.
FIG 5 shows that the participants did report a difference in intensity as the 15s RPE’s are higher than the 120s from sprint 4-10. (p>0.05) showing no statistical significance.

FIG 5 Mean RPE scores after each of the 10x25m sprints ± SD for both 15s and 120s.
Discussion
The focus of this study was to determine whether there was a difference in performance levels (times of sprints) dependant on the duration of recovery (15s, 120s). From statistical analysis of the results of the sprint times, it is evident that there was a clear significance between the two recovery durations (p<0.05). The 120s recovery period allowed sufficient levels of PCr to make a contribution to the resynthesis of ATP prior to each sprint (Glaister 2005), allowing for more consistent sprint times. PCr regeneration is critical when understanding that Gaitanos (1993) found PCr was reported 80% of the total anaerobic ATP provision during the final bout of 10 X 6s maximal sprints (30 s recovery). On the reverse side, the half time for PCr resynthesis is >22s concluding that the 15s recovery period wasn’t enough time to allow sufficient PCr regeneration (Ferrauti 2001), meaning a lower contribution towards power output from PCr, resulting in an inhibition of contractile activity through a decrease in the muscle pH, thus resulting in slower times after the first few sprints (Balsom et al 1992; Bogdanis et al; 1996). This is supported by Harris et al (1976) when reporting PCr would only get back to 50% of its original state after a 21s rest period.
The results from the fatigue index show a significant difference between 15s and 120s (p<0.05). The fact that the times produced in the sprints were mainly regulated by the PCr availability provides a strong reason why the blood lactate levels were significantly higher in the post 15s, which has limitations on the body’s contractile capabilities, resulting in a decreased power output (Glaister 2005). The reduced ability to regenerate sufficient levels of PCr in the 15s interval would result in a demand on anaerobic Glycolysis for the maintenance of ATP resynthesis leading to a lower power output. The minimum recovery duration to maintain the initial peak power output during two successive sprints of 8 s was around 30 s (Billaut et al 2003), further explaining the 15s recovery was insufficient. The Half-time for the removal of lactic acid from the body is around 9 minutes, meaning a 15s rest period would be virtually useless in any kind of meaningful removal. Glaister (2005) suggests blood lactate is the reflection of production to removal ratio and implies that more research on this matter needs to be assembled. It is acknowledged by many researchers that the onset of lactic acid occurs during high intense sporting activities, reports have indicated a negative impact on performance (Astrand 1963). Newer research however, suggests that the lactate is in fact a critical link between energy processes and provides key fuels (glycogenolysis) (Brooks 2007). Westerblad et al (2002) suggests that the Hydrogen (H+) ions are the limiting factor in the production of lactic acid as they contribute to acidosis whereby the normal pH = 7.35 – 7.45; decrease by 0.5 during intense activity, proposing several mechanisms of fatigue. It is therefore important for this build up of lactate to be removed in order to disassociate the body with any build up of H+ ions. 120s recovery will have a more likely chance of offering sufficient aerobic active rest time (McArdle et al 2000) to aid the removal, unlike that of the 15s duration. This would be a contributor to the slower sprint times in the 15s recovery test. The fourth type of peripheral fatigue; the build up of iP molecules has been reported to be more of contributor of fatigue (in high intense activities) than lactic acid, according to newer research. This is Due to the inhibitory effect on sarcoplasmic reticulum calcium release (Westerblad 2002). Removing accumulated iP from the body during the recovery process is done by adenosine diphosphate and creatine phosphorylation which relies on the presence of oxygen (Glaister 2005; Spencer 2005). Therefore the 120s rest period will allow for more sufficient recovery periods likely to aid the removal of iP at a higher level than the 15s recovery as a result of more time for oxygen consumption. Gaitanos et al (1993) tested 8 healthy male Physical education students with an average age of 26. 10x6s maximum sprints were performed with passive 30 seconds recovery in between them. Results indicated from interval 1 to interval 10, the rate of ATP derived from PCr dropped 45%, while the rate of ATP derived from Glycolysis dropped 85%. The total anaerobic contribution dropped by 65% from the first to the last sprint. By the last sprint, the rate of lactate production decreased 10-fold. Despite a huge reduction in Glycolitic energy production, the mean power output between intervals 1 and 10 only fell 27%. Although seen as circumstantial data by many researchers, the findings seem to show a significant shift to aerobic metabolism at the latter stages of the exercise test, due to a reduced anaerobic energy yield.
Conclusion
The influence of recovery duration on multiple-sprint performance has been investigated using two different recovery durations (15s and 20s). I have discovered that shorter rest durations result in a lower power output in later sprints due to inadequate time to get the body back towards a homeostasis state; this resulted in slower sprint times, increased blood lactate and a higher fatigue index. My results were supported by current literature that studied similar research topics.
Author: Jon Shaw
Reference List
Astrand, P.O. Hallback, I. Hedman, R. Saltin, B. (1963) Blood lactates after prolonged severe exercise. Applied Physiology. 18: 619–622
Balsom, P.D. Seger, J.Y. Sodjin, B. Bekblom, B. (1992) Maximal intensity intermittent exercise: Effect of recovery duration. Sports Med. 13:528-533.
Billaut, V.L. Sirvent, P.P. Koralsztein, J.P. Mercier, J. (2003)The concept of maximal lactate steady state. Sport Med 33: 406–426.
Bogdanis, G.C. Nevile, M.E. Boobis, L.H. Lakomy, H.K. Nevile, A.M.(1995) Recovery of power output and muscle metabolites following 30 s of maximal sprint cycling in man. Journal of Physiology. 482: 467-480.
Borg, G. (1982) Psychophysical bases of perceived exertion. Medicine and Science in Sports and Exercise, 14 (5), p. 377-81
Brooks, G.A. (2007) Lactate: Link Between Glycolytic and Oxidative Metabolism. Sports Medicine, 37 (4-5), 341-343.
Dick, F.W. (2002) Sports training principles. 4th edition. London, A&C Black (publishers) Ltd.
Ferrauti, A., Pluim, B. & Weber, K. (2001) The effect of recovery duration on running speed and stroke quality during intermittent training drills in elite tennis players. Journal of Sport Sciences [Online] 19, 235-242. Available from: Academic Search Elite [Accessed November 2012].
Gaitanos, G.C.C. Williams, L. Brooks, S. (1993) Human muscle metabolism during intermittent maximal exercise. Applied Physiology. 75:712-719. 1993.
Glaister, M., Stone, M.H., Stewart, A.M., Hughes, M. & Moir, G.L. (2005) The influence of recovery duration on multiple sprint cycling performance. Journal of Strength and Conditioning Research [Online] 19 (4), 831-837. Available from Academic Search Elite [Accessed 27th July 2011].
Harris, R.C. Edwards, R.H.T. Hultman, E. (1976) the time course of phosphorylcreatine resynthesis during recovery of the quadriceps muscle in man. 367: 137-42
McArdle, W.D, Katch., F.I. & Katch, V.L. (2000) Essentials of Exercise Physiology. Baltimore, Lippincott Williams & Wilkins.
McMahon S. and Jenkins D. (2002) Factors affecting the rate of phosphocreatine resynthesis following intense exercise. Sports Med. 32(12): 761-84.
Medbo, J.I. Gramvik, P. Jebens, E. (1999) Aerobic and anaerobic energy release during 10 and 30 s bicycle sprints. Actaual Kinesiology, University: 4, 122-46
Noakes T.D. (2000) Physiological models to understand exercise fatigue and the adaptations that predict or enhance athletic performance. Scandinavian Journal of Medicine and Science in Sports. 10: 123-145
Oliver, J.L. Armstrong, B. Williams, A. (2009) Relationship between brief and prolonged repeated sprint ability. Journal of Science and Medicine in Sport.12, 238—243
Robergs, R.A. & Robergs, S.O. (1997) Exercise Physiology: Exercise, Performance and Clinical Applications. St Louis, Mosby.
Spencer, M. Bishop, D. Dawson, B. (2005) Physiological and Metabolic Responses of Repeated-Sprint Activities Specific to Field-Based Team Sports. Sports Med 2005; 35(12): 1025-1044
Westerblad, H., Allen, D.G. and Lannergren, J. (2002) Muscle fatigue: Lactic Acid or Inorganic Phosphate the Major Cause? News Physiological Science, 17, 17-21.
 sending...